Testing the MH-Z19 Infrared CO2 Sensor Module

Introduction:
In this article we will do a simple functional test of the MH-Z19 CO2 sensor by connecting it to a raspberry pi 3 UART and run a simple datalogger python program which prints results to the screen and stores results in a csv formatted file.
The file can later be imported to matlab or excel for further analysis or just plot a graph of the collected data.
If you want to use a PC or Raspberry Pi or Beaglebone or any other SOC to measure CO2 levels, a sensor with a serial interface is a good choice. The MH-Z19 features a UART serial interface and 5V power supply and 3.3V IO levels. This makes is easy to connect it directly to a Raspberry Pi or to a PC (If PC, you need to use an USB/serial converter(CMOS/TTL levels, not RS232 levels)). It also features an pulse width modulated (PWM) output where the duty cycle changes with CO2 concentration which could be buffered and low pass filtered to get an analog signal representing the CO2 level.
Save health and energy with CO2 sensors
When breathing, humans and animals increase the concentration if CO2 in the exhaled air. This is a normal biological process. In the outside, this is not a problem as plants consume the additional CO2. Burning fossil fuels also increase the outside CO2 levels, and the plants cannot handle such a huge amounts which creates very negative long term effects, but that is not what we are talking about here.
However, in closed living rooms without enough ventilation, CO2 levels can increase quite a lot from the initial outside levels of 400 ppm to inside levels of 2000-3000ppm. High CO2 levels, above 1000ppm, can lead to drowsiness, poor concentration, loss of attention or increased heart rate.
Especially modern buildings without a well-designed ventilation system can be a bit problematic. Therefore, monitoring CO2 levels in living rooms is a good idea as it gives you a good indication when you should increase the ventilation (e.g. by opening the windows for some time).
Large buildings like schools and office buildings have huge ventilation systems which use a lot of electric power just to make sure that the inside air is cooled or heated and replaced within a certain interval of time to make sure the inside air is of good quality 24/7. A lot of energy can be saved by controlling such a system based on strategically placed CO2 sensors around the building and run the system based on demand caused by occupancy rather than continuously or controlled by a simple timer.
Such a CO2-based demand controlled ventilation system can control the amount of outdoor fresh air supply in a building depending on the number of people and their activity. People are the main source of CO2 in a building. If the number of people in a room is doubled, the CO2 level will accordingly double. If one or few people leave a room, the level of CO2 will proportionally decrease. Hence, demand controlled ventilation saves energy solely by not replacing, heating, or cooling, unnecessary amount of outdoor air.

About the MH-Z19 CO2 sensor
The MH-Z19 sensor is manufactured by Winsen Lt., China and the measurement method used is based on the non-dispersive infrared (NDIR) principle to detect the existence of CO2 in the air.
Key features according to the manufacturer are:
Key features according to the manufacturer are:
- good sensitivity.
- non-oxygen dependent.
- long life.
- built-in temperature compensation.
- UART serial interface and Pulse Width Modulation (PWM) output.
A nondispersive infrared sensor (or NDIR sensor) is a relatively simple spectroscopic sensor often used as a gas detector. It is nondispersive in the sense of optical dispersion since the infrared energy is allowed to pass through the atmospheric sampling chamber without deformation.
Principle of operation:
The main components of an NDIR sensor are an infrared source (lamp), a sample chamber or light tube, a light filter and an infrared detector. The IR light is directed through the sample chamber towards the detector. In parallel there is another chamber with an enclosed reference gas, typically nitrogen. The gas in the sample chamber causes absorption of specific wavelengths according to the Beer–Lambert law, and the attenuation of these wavelengths is measured by the detector to determine the gas concentration. The detector has an optical filter in front of it that eliminates all light except the wavelength that the selected gas molecules can absorb.
The MH-Z19B NDIR infrared CO2 gas detection module is typically used in:
- HVAC equipment in schools, office buildings etc.
- Green houses
- Indoor air quality monitoring.
- Smart home appliances
The user manual can be found here. or at //www.winsen-sensor.com
Technical specification :
Technical specification :
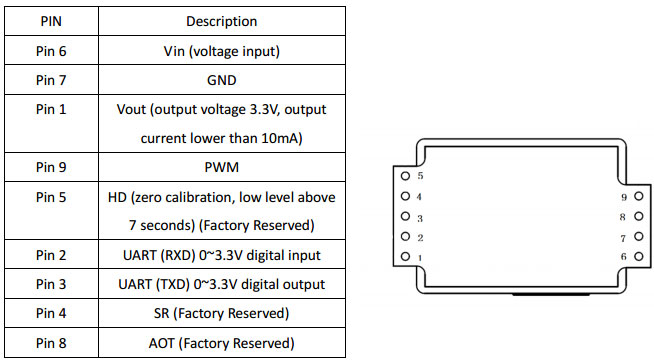
Looking at the sensor from the bottom, you will see the following pins:
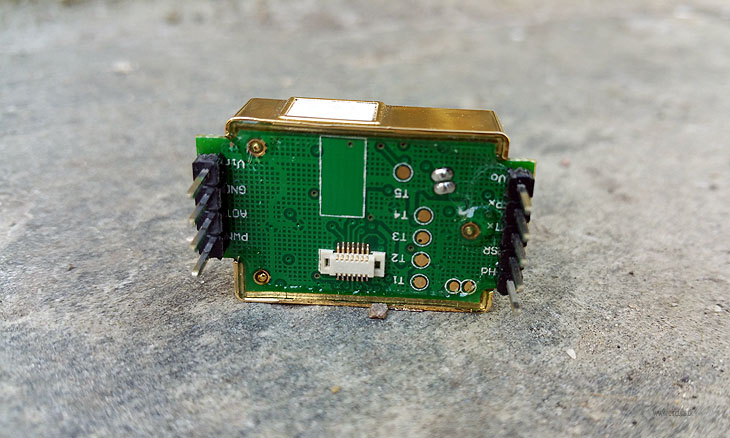
The pins have a 2.54mm (0.1″) pitch, that makes it easy to solder a simple one-row pin header as shown in Fig. 1 above.
Connecting to the Raspberry Pi:

The MH-Z19 have a internal 5V to 3.3V low drop analog voltage regulator. This makes the logic signals on RX and TX compatible to the Raspberry Pi logic levels which are CMOS 3.3V. Hence, no level converters are needed.
Preparing the Raspberry Pi 3 for UART communication.
The Raspberry pi UART present on the GPIO (the 40-pin connector) requires some preparing before use.
You have to:
-Turn off the console if it is using the UART as login shell.
-Enable the UART in the /dev/config.txt file.
Detailed information on how to configure the UART on Raspberry Pi 3 can be found here.
You have to:
-Turn off the console if it is using the UART as login shell.
-Enable the UART in the /dev/config.txt file.
Detailed information on how to configure the UART on Raspberry Pi 3 can be found here.
MH-Z19 python datalogger test program
The simple test program opens the UART com port 
serial0 and tries to read CO2 measurement values from the CO2 sensor every minute. The program prints every measurement to the screen and logs timestamped measurements to a csv formatted file, which is given the current date and time as the filename. Improvements to the program are welcome #!/usr/bin/python
import serial, os, time, sys, datetime, csv
def logfilename():
now = datetime.datetime.now()
#Colon is not alowed in filenames so we have to include a lookalike char
return 'CO2LOG-%0.4d-%0.2d-%0.2d-%0.2d%s%0.2d%s%0.2d.csv' %
(now.year, now.month, now.day, now.hour,
u'ua789',now.minute, u'ua789', now.second)
#Function to calculate MH-Z19 crc according to datasheet
def crc8(a):
crc=0x00
count=1
b=bytearray(a)
while count<8:
crc+=b[count]
count=count+1
#Truncate to 8 bit
crc%=256
#Invert number with xor
crc=~crc&0xFF
crc+=1
return crc
# try to open serial port
port='/dev/serial0'
sys.stderr.write('Trying port %sn' % port)
try:
# try to read a line of data from the serial port and parse
with serial.Serial(port, 9600, timeout=2.0) as ser:
# 'warm up' with reading one input
result=ser.write("xffx01x86x00x00x00x00x00x79")
time.sleep(0.1)
s=ser.read(9)
z=bytearray(s)
# Calculate crc
crc=crc8(s)
if crc != z[8]:
sys.stderr.write('CRC error calculated %d bytes= %d:%d:%d:%d:%d:%d:%d:%d crc= %dn' % (crc, z[0],z[1],z[2],z[3],z[4],z[5],z[6],z[7],z[8]))
else:
sys.stderr.write('Logging data on %s to %sn' % (port, logfilename()))
# log data
outfname = logfilename()
with open(outfname, 'a') as f:
# loop will exit with Ctrl-C, which raises a KeyboardInterrupt
while True:
#Send "read value" command to MH-Z19 sensor
result=ser.write("xffx01x86x00x00x00x00x00x79")
time.sleep(0.1)
s=ser.read(9)
z=bytearray(s)
crc=crc8(s)
#Calculate crc
if crc != z[8]:
sys.stderr.write('CRC error calculated %d bytes= %d:%d:%d:%d:%d:%d:%d:%d crc= %dn' % (crc, z[0],z[1],z[2],z[3],z[4],z[5],z[6],z[7],z[8]))
else:
if s[0] == "xff" and s[1] == "x86":
print "co2=", ord(s[2])*256 + ord(s[3])
co2value=ord(s[2])*256 + ord(s[3])
now=time.ctime()
parsed=time.strptime(now)
lgtime=time.strftime("%Y %m %d %H:%M:%S")
row=[lgtime,co2value]
w=csv.writer(f)
w.writerow(row)
#Sample every minute, synced to local time
t=datetime.datetime.now()
sleeptime=60-t.second
time.sleep(sleeptime)
except Exception as e:
f.close()
ser.close()
sys.stderr.write('Error reading serial port %s: %sn' % (type(e).__name__, e))
except KeyboardInterrupt as e:
f.close()
ser.close()
sys.stderr.write('nCtrl+C pressed, exiting log of %s to %sn' % (port, outfname))
Running the test program
Save the testprogram above as mhz19.py.
Open a terminal window (Rasbian Lxterminal) and enter:
Open a terminal window (Rasbian Lxterminal) and enter:
sudo python mhz10.py
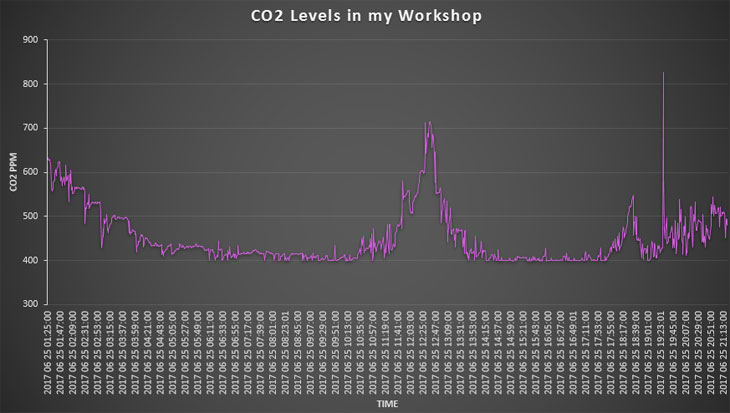
The figure below shows the output of the simple mhz19.py test program. The CO2 measurements are sampled every minute.

This is the contents of the csv formatted log file:

This csv file format can easily be imported to excel and plotted as a graph:
Calibrating the CO2 sensor
CO2 Sensor Calibration: What You Need to Know
All carbon dioxide sensors need calibration. Depending on the application, this can be accomplished by calibrating the sensor to a known gas, or using the automatic baseline calibration (ABC) method. Both have pros and cons you should know.
All carbon dioxide sensors need calibration. Depending on the application, this can be accomplished by calibrating the sensor to a known gas, or using the automatic baseline calibration (ABC) method. Both have pros and cons you should know.
Why Calibrate?
The non-dispersive infrared (NDIR) carbon dioxide sensors rely on an infrared light source and detector to measure the number of CO2 molecules in the sample gas between them. Over many years, both the light source and the detector deteriorate, resulting in slightly lower CO2 molecule counts.
To combat sensor drift, during calibration a sensor is exposed to a known gas source, multiple readings are taken, an average is calculated, and the difference between the new reading and the original reading when the sensor was originally calibrated at the factory is stored in EPROM memory. This “offset” value is then automatically added or subtracted to any subsequent readings taken by the sensor during use.
Calibration Using Nitrogen
The most accurate method of CO2 sensor calibration is to expose it to a known gas (typically 100% nitrogen) in order to duplicate the conditions under which the sensor was originally calibrated at the factory. Nitrogen calibration is also required if CO2 levels between 0-400 ppm will be measured. The problem with calibrating using nitrogen is the expense. A sealed calibration enclosure, a tank of pure nitrogen, and calibration software is required to match the original factory testing environment. Otherwise, the accuracy of the calibration cannot be ensured.
Calibration Using Fresh Air
Where maximum accuracy is less important than cost, a CO2 sensor can be calibrated in fresh air. Instead of calibrating at 0ppm CO2 (nitrogen), the sensor is calibrated at 400ppm CO2 (outdoor air is actually very close to 400ppm), then 400 ppm is subtracted from the newly calculated offset value.
Fresh air calibration is best for sensors in manufacturing settings or greenhouses where the sensor is constantly exposed to different CO2 levels.
Fresh air calibration is best for sensors in manufacturing settings or greenhouses where the sensor is constantly exposed to different CO2 levels.
Automatic calibration
Automatic calibration is based on the fact that in a common environment, the CO2 level comes back to the norm (400ppm CO2) periodically, at least every few days. Starting from there, you can make your measurement software constantly monitor the lowest observed CO2 level over a period of several days. If these lowest values diverge from the norm, your sensor software could gradually make a correction to compensate for the change.
This is an efficient and reliable method for a typical environment where the CO2 level goes back to normal when there is no CO2 production for a few hours: during the night for businesses, during the day for a bedroom.
This is an efficient and reliable method for a typical environment where the CO2 level goes back to normal when there is no CO2 production for a few hours: during the night for businesses, during the day for a bedroom.
Conclusion
The MH-Z19 seems to work as expected.
留言
張貼留言